Airbnb Market Share of U.S. Hotel Demand
In this article, Hotel Appraisers & Advisors (HA&A) estimates Airbnb’s market share of U.S. lodging demand. This year’s edition of our study differs from prior publications in two major ways. Firstly, we isolate data from Airbnb, while excluding data from other, smaller home-sharing companies that were included in prior publications. Secondly, we have focused our analysis on Airbnb demand that we believe is most like traditional hotel lodging demand. We exclude, for example, the rental of shared rooms or rooms with shared living quarters.
Since its creation in 2007, Airbnb has become a dominant channel for selling lodging services that would otherwise be excess residential capacity. The company helps residential owners register, market, and sell excess residential capacity as lodging supply. As an early industry disrupter, Airbnb’s sharing economy application has become the leader in this niche of the lodging sector.[1] In this article, we estimate Airbnb’s market share of U.S. lodging demand, measured by room nights sold. We discuss historical growth rates, the recent deceleration of Airbnb’s U.S. demand growth, and implications for the lodging industry.
HA&A collaborated with AirDNA[2] and relied on various additional data providers, such as STR, Statista, confidential interviews, and our own proprietary models, to develop various estimates shown in this report. Airbnb denied multiple requests to publicly share data that would confirm the estimates shown throughout this report. Although we believe estimates in this report are accurate, the author makes no guarantee about accuracy, and estimates in this report should not be relied on for investment decisions.
The following figure illustrates our estimate of Airbnb’s U.S. lodging demand growth from 2008 through 2018.
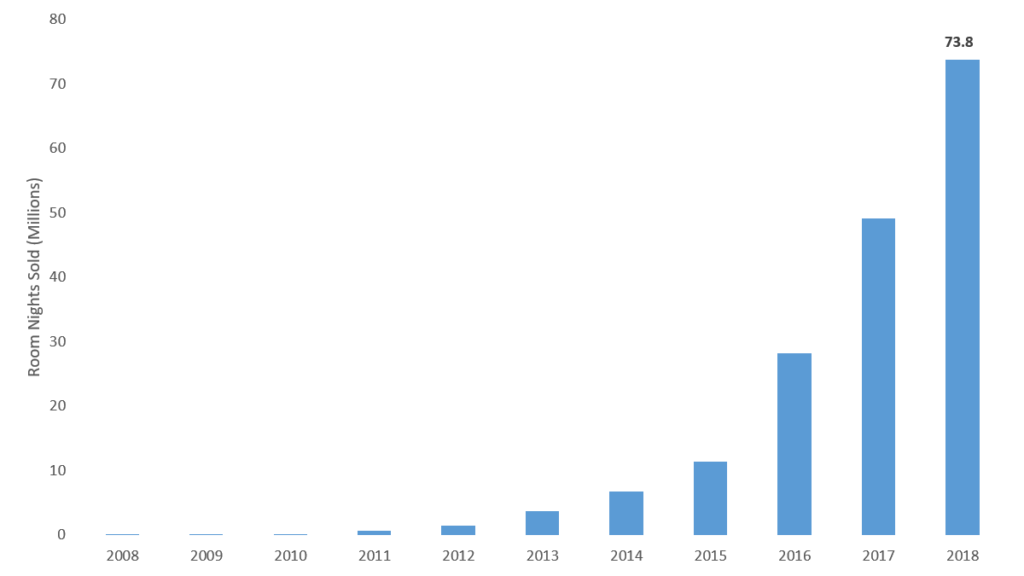
Demand has grown rapidly during the past few years. According to estimates from AirDNA, the total number of U.S. listing nights[3] booked through Airbnb in 2018 was approximately 73.8 million. To make this data as relevant as possible for comparisons in the lodging industry, HA&A focused our analysis specifically on rentals that feature entire homes or apartments that were not lived in by the host during a guest’s stay or shared by other guests.
Recent monthly data from AirDNA provides strong evidence that the demand growth pace for Airbnb is slowing rapidly in the U.S. Even though demand is still growing, the pace of demand growth has decelerated remarkably in recent months. We expect the pace of U.S. demand growth for this type of lodging will eventually stabilize at a rate consistent with overall lodging demand growth in the U.S.
The following figure illustrates how the pace of demand growth for Airbnb has decelerated during the past 18 months in the U.S.
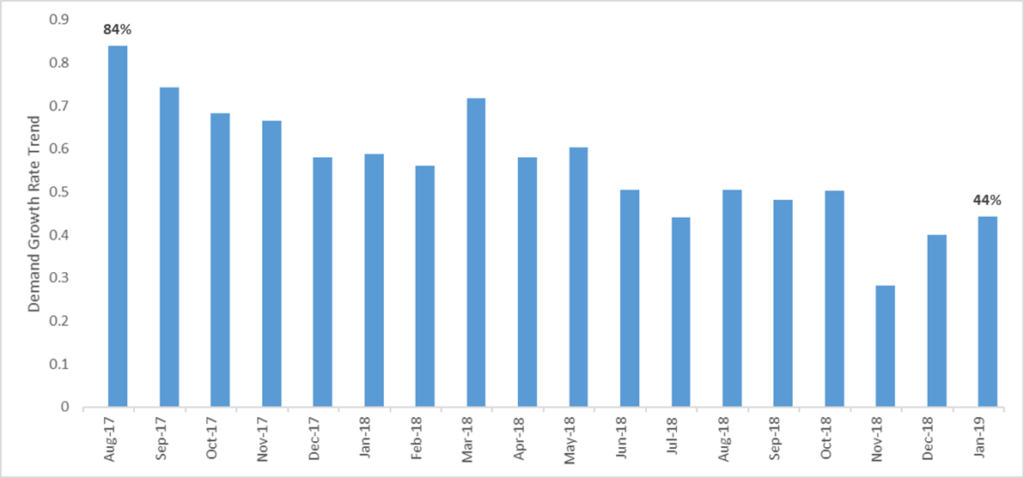
The preceding figure shows the percentage growth in U.S. listing nights booked through Airbnb for a given month compared to the same month in the prior year. For example, listing night bookings in August of 2017 were approximately 84 percent greater than listing night bookings in August of 2016. By contrast, the number of listing nights booked in January of 2019 were only about 44 percent greater than the number of listing nights booked in January of 2018. By comparison to the hotel industry, this still represents a robust growth rate.[4] However, the growth rate appears to be slowing.
The sharing economy’s rapid growth has made Airbnb a significant participant in the U.S. lodging industry. Its market share has grown from nothing to the mid single-digits over the span of a decade. Based on Airbnb’s recent growth trends, its market share of U.S. lodging demand is likely to increase further before stabilizing.
Based on our estimates and data from AirDNA, the following figure illustrates Airbnb’s booking demand[5] as a share of total U.S. lodging demand.
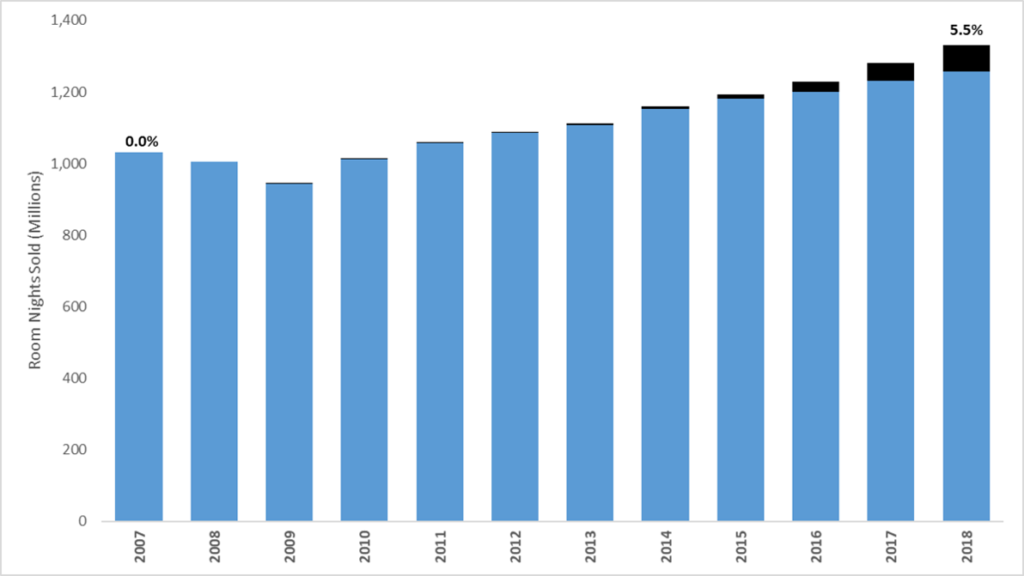
Airbnb’s market share has grown rapidly during the past few years. HA&A estimates that Airbnb accounted for approximately 5.5 percent of all[6] paid U.S. lodging demand in 2018.
Several major hotel chains and lodging industry groups have communicated concern about Airbnb as a threat to hotel owners. However, the news is not all bad for investors in traditional hotels. If the Airbnb fee model proves itself as a long-term profit-maker, then we expect major hotel chains to acquire or develop similar platforms to offer their customers more lodging options in the sharing economy. The large hotel companies should also benefit from the brand loyalty, sophisticated data tracking, and powerful reservation systems they have worked so hard to develop. These could represent long-term competitive advantages that the major hotel companies could leverage to cut into Airbnb’s market share during the next decade.
Many of the figures discussed throughout this article include estimates. This report is intended for discussion purposes only and is not intended to be construed as investment advice.
[1] Other sharing economy home rental companies include FlipKey, HomeAway, HouseTrip, OneFineStay, Tripping, and VRBO. This article includes data from Airbnb only, the largest player in the U.S. market.
[2] AirDNA developed a proprietary methodology to estimate the number of room nights available and booked through Airbnb’s platform. The company offers local and national market data, available for purchase.
[3] AirDNA defines listing nights as the sum of all nights that were available for rent. This is distinct from their use of the term “room nights” for which they multiply listing nights times the number of bedrooms available for rent in each property. To make better comparisons to the hotel industry, HA&A focuses this article on listing nights that feature the entire place for rent, and we exclude rented bedrooms in non-private properties. As such, Airbnb’s listing nights booked are similar to what traditional hoteliers refer to as room nights sold.
[4] Overall U.S. hotel demand grew by approximately 2.1 percent in 2018, according to data from STR.
[5] Hoteliers typically define demand as room nights sold while AirDNA defines demand as listing nights booked.
[6] This estimate includes all chain and independently branded hotels and motels, but excludes other shared lodging companies, such as HomeAway.